Pages

Tuesday, 24 May 2011

Rumours Of Iran Euro Sales Heigtens the USD Currency

Rumors from Iran Central bank said that the management had decided to diminish EURO reserves to 20-25 percent from 50 percent and then convert the euro currency into the Dollars and Gold. It is also heard in the market that the sales of the first stage is begin and its target seems to be 15 billion was expected to be finish off till the end of September. EUR 45 billion is expected amount for the whole sales. Iran is expected to reduce its cost of oil sales in euro. While buying seems to be low and USD stays tight against all the major currencies of the Forex online trading market. Prime Minsiter of Japan has announced its resignation leads to the Japanese currency Yen in the soft order in the market. This announcement of resignation is just come before week and now the currenct finance minster of Japan is the successor as the market expects for the chair of Prime Minsiter.

According to the report presented by the Challenger, Gray the US planned to dropped layoff early makes a fall of 65 percent in the month of May where as eurozone PPI rises to 0.9 percent mom. Aussie GDP reaches to a high of 0.5 percent qoq and 2.7 percent yoy in the first quarter of this year that is 2010. While Swiss retail sales rises to 1.3 percent yoy in the month of April. Monetary base roses to 3.7 percent yoy in the end of the may month. Although the Japan currency is not going as good because of the political uncertainity where as apart from this the US currency is gaining as the demand of risky assets rose.

We have seen that the currency pair USD/JPY reaches to the high level of 92.36 first time after the eigteenth of may where as the currency pair EUR/JPY reaches to 113 level as anticipated in the market after the recovery of the US labor market. In the market rumuors are going on about the next leader of Japan that was expected to the current finance minster will take the vacant position of the Prime Minster of Japan that ultimately leads the Yen currency to lag behind in the market from some past days. Th finance minister of Jpana suggested the BOJ to do not look steady at the market try to fight against the deflation to stop it. While rise is seen in the Asia Pacific of 2.4 percent and the Nikkie embedded the goodness in the stocks by rising 2.46 percent more. The stocks seems to be rebound and also triggers the risk appetite because of the japanese investors amendment foriegn bond net purchases to the most expected till the month of September.

There was a advancement shown in the currency pair of AUD/USD that seems to be rises to 0.5 percent and the currency pair NZS/USD rises to 0.4 percent in the consecutive second day at the Forex market. This is all due to the strong economic data that comes from US while the Aussie demands for the risk appetite. Where as the trade balance of the Australian trade adds the surplus in the month of April as there was a high jump shown in the iron ore exports that is of 25 percent more from the past, coal shipments rises to 40 percent more where as the exports also rises to 11 percent as comapred to the April month. RBA has forecasted that the boom of Asia srocks may lag the Australias's trade in the coming time.

The currency pair EUR/USD seems to be in good path as it seems to be rises from 1.2111 to 1.2281 on first june. It gets the support from the stocks rise in the starting of this month. While as about the US economy it was predicted yesterday that the US comapnies are ready to launch 70,000 jobs as the intial jobless came fells to 455,000 from the previous 460,000. In this week there was a meet fixed between the Finance minsters with central bankers of G20 in Bussan that was in South Korea which decides about the current situation of EURO debt crisis. The currencty finance minster of Japan mentioned in his one of the interview that the european debt crisis leads an adverse effect on the Global economic growth of the country merely because of the leading trading countries that is China, india and Brazil are still ready to fight against the deflation as they are robust enough.
Forex: Ichimoku Cloud Filters Information Storm

The Ichimoku Kinko Hyo or equilibrium chart isolates higher probability trades in the forex market. It is new to the mainstream, but has been rising incrementally in popularity among novice and experienced traders. More known for its applications in the futures and equities forums, the Ichimoku displays a clearer picture because it shows more data points, which provide a more reliable price action. The application offers multiple tests and combines three indicators into one chart, allowing the trader to make the most informed decision. Learn how the Ichimoku works and how to add it to your own trading routine.

Getting to Know Ichimoku
Before a trader can trade effectively on the chart, a basic understanding of the components that make up the equilibrium chart need to be established. Created and revealed in 1968, the Ichimoku was developed in a manner unlike most other technical indicators and chart applications. Usually formulated by statisticians or mathematicians in the industry, the indicator was constructed by a Tokyo newspaper writer named Goichi Hosoda and a handful of assistants running multiple calculations.What they came up with is now used by many Japanese trading rooms because it offers multiple tests on the price action, creating higher probability trades. Although many traders are intimidated by the abundance of lines drawn when the chart is actually applied, the components can be easily translated into more commonly accepted indicators.

Essentially made up of four major components, the application offers the trader key insight into FX market price action. First, we'll take a look at both the Tenkan and Kijun Sens. Used as a moving average crossover, both lines are simple translations of the 20- and 50-day moving averages, although with slightly different time frames.

1. The Tenkan Sen - Calculated as the sum of the highest high and the lowest low divided by two. The Tenkan is calculated over the previous seven to eight time periods.

2. The Kijun Sen - Calculated as the sum of the highest high and the lowest low divided by two. Although the calculation is similar, the Kijun takes the past 22 time periods into account.

Now let's take a look at the most important component, the Ichimoku "cloud", which represents current and historical price action. It behaves in much the same way as simple support and resistance by creating formative barriers. The last two components of the Ichimoku application are:

3. Senkou Span A - The sum of the Tenkan Sen and the Kijun Sen divided by two. The calculation is then plotted 26 time periods ahead of the current price action.

4. Senkou Span B - The sum of the highest high and the lowest low divided by two. This calculation is taken over the past 44 time periods and is plotted 22 periods ahead.

Once plotted on the chart, the area between the two lines is referred to as the Kumo, or cloud. Comparatively thicker than your run-of-the-mill support and resistance lines, the cloud offers the trader a thorough filter. Instead of giving the trader a visually thin price level for support and resistance, the thicker cloud will tend to take the volatility of the currency markets into account. A break through the cloud and a subsequent move above or below it will suggest a better and more probable trade. Let's take a look Figure 2's comparison.

To Recap:

1. Refer To The Kijun / Tenkan Cross - The potential crossover in both lines will act in similar fashion to the more recognized moving average crossover. This technical occurrence is great for isolating moves in the price action.

2. Confirm Down / Uptrend With Chikou - Confirming that the market sentiment is in line with the crossover will increase the probability of the trade as it acts in similar fashion with a momentum oscillator.

3. Price Action Should Break Through The Cloud - The impending down/uptrend should make a clear break through of the cloud of resistance/support. This decision will increase the probability of the trade working in the trader's favor.

4. Follow Money Management When Placing Entries - By adhering to strict money management rules, the trader will be able to balance risk/reward ratios and control the position.

The Round Up
This indicator is intimidating at first, but once the Ichimoku chart is broken down, every trader from novice to advanced will find the application helpful. Not only does it mesh three indicators into one, but it also offers a more filtered approach to the price action for the currency trader. Additionally, this approach will not only increase the probability of the trade in the FX markets, but will assist in isolating only the true momentum plays. This is opposed to riskier trades where the position has a chance of trading back former profits.

Spread-To-Pip Potential: Which Pairs Are Worth Day Trading

Spreads play a significant factor in profitable forex trading. When we compare to the average spread to the average daily movement many interesting issues arise. Namely, some pairs are more advantageous to trade than others. Secondly, retail spreads are much harder to overcome in short-term trading than some may anticipate. Third, a "larger" spread does not necessarily mean the pair is not as good for day trading when compared to some lower spread alternatives. Same goes for a "smaller" spread - it does not mean it is better to trade than a larger spread alternative.

Establishing a Base Line
To understand what we are dealing with, and which pairs are more suited to day trading, a base line is needed. For this the spread is converted to a percentage of the daily range. This allows us to compare spreads versus what the maximum pip potential is for a day trade in that particular pair. While the numbers below reflect the values in existence at a particular period of time, the test can be applied at any time to see which currency pair is offering the best value in terms of its spread to daily pip potential. The test can also be used to cover longer or shorter periods of time.

These are the daily values and approximate spreads (will vary from broker to broker) as of April 7, 2010. As daily average movements change so will the percentage that the spread represents of the daily movement. A change in the spread will also affect the percentage. Please note that in the percentage calculation the spread has been deducted from the daily average range. This is to reflect that retail customers cannot buy at the lowest bid price of the day shown on their charts.
  • EUR/USDDaily Average Range (12):105
    Spread: 3
    Spread as a percentage of maximum pip potential: 3/102= 2.94%
  • USD/JPYDaily Average Range (12):80
    Spread: 3
    Spread as a percentage of maximum pip potential: 3/77= 3.90%
  • GBP/USDDaily Average Range (12):128
    Spread: 4
    Spread as a percentage of maximum pip potential: 4/124= 3.23%
  • EUR/JPYDaily Average Range (12):121
    Spread: 4
    Spread as a percentage of maximum pip potential: 4/117= 3.42%
  • USD/CADDaily Average Range (12):66
    Spread: 4
    Spread as a percentage of maximum pip potential: 4/62= 6.45%
  • USD/CHFDaily Average Range (12):98
    Spread: 4
    Spread as a percentage of maximum pip potential: 4/94= 4.26%
  • GBP/JPYDaily Average Range (12):151
    Spread: 6
    Spread as a percentage of maximum pip potential: 6/145= 4.14%

Which Pairs to Trade
When the spread is placed into percentage terms of the daily average move, it can be seen that the spread can be quite significant and have a large impact on day-trading strategies. This is often overlooked by traders who feel they are trading for free since there is no commission.

If a trader is actively day trading and focusing on a certain pair, making trades each day, it is most likely they will trade pairs that have the lowest spread as a percentage of maximum pip potential. The EUR/USD and GBP/USD exhibit the best ratio from the pairs analyzed above. The EUR/JPY also ranks high among the pairs examined. It should be noted that even though the GBP/USD and EUR/JPY have a four-pip spread they out rank the USD/JPY which commonly has a three pip spread.

In the case of the USD/CAD, which also has a four-pip spread, it was one of the worst pairs to day trade with the spread accounting for a significant portion of the daily average range. Pairs such as these are better suited to longer term moves, where the spread becomes less significant the further the pair moves.

Adding Some Realism
The above calculations assumed that the daily range is capturable, and this is highly unlikely. Based simply on chance and based on the average daily range of the EUR/USD, there is far less than a 1% chance of picking the high and low. Despite what people may think of their trading abilities, even a seasoned day trader won't fair much better in being able to capture an entire day's range - and they don't have to.

Therefore, some realism needs to be added to our calculation, accounting for the fact that picking the exact high and low is extremely unlikely. Assuming that a trader is unlikely to exit/enter in the top 10% of the average daily range, and is unlikely to exit /enter in the bottom 10% of the average daily range, this means that trader has 80% of the available range available to them. Entering and exiting within this area is more realistic than being able to enter right in the area of a daily high or low.

Using 80% of the average daily range in the calculation provides the following values for the currency pairs. These numbers paint a portrait that the spread is very significant.
  • EUR/USDSpread as a percentage of possible (80%) pip potential: 3/81.6= 3.68%
  • USD/JPYSpread as a percentage of maximum pip potential: 3/61.6= 4.87%
  • GBP/USDSpread as a percentage of possible (80%) pip potential: 4/99.2= 4.03%
  • EUR/JPYSpread as a percentage of possible (80%) pip potential: 4/93.6= 4.27%
  • USD/CADSpread as a percentage of possible (80%) pip potential: 4/49.6= 8.06%
  • USD/CHFSpread as a percentage of possible (80%) pip potential: 4/75.2= 5.32%
  • GBP/JPYSpread as a percentage of possible (80%) pip potential: 6/116= 5.17%

With the exception of the EUR/USD, which is just under, 4%+ of the daily range is eaten up by the spread. In some pairs the spread is a significant portion of the daily range when factoring for the likely possibly that the trader will not be able to accurately pick entries/exits within 10% of the high and low which establish the daily range.

G7 Leads Shift in Forex Reserves

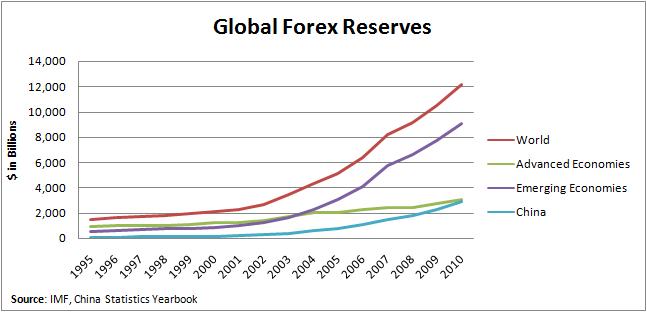
As you can see from the chart below, the world’s foreign exchange reserves (held by central banks) have undergone a veritable explosion over the last decade. While emerging markets (especially China!) have accounted for the majority of this growth, there are indications that this could soon change. China’s reserve accumulation is set to slow, while advanced economies’ reserves are set to increase.

In the past, central banks from advanced economies have accumulated reserves only sparingly, and in fact, much of this growth can be claimed by Japan. This is no mystery. While held by emerging economy central banks, most of the reserves are denominated in advanced economy currencies. This has ensured a plentiful supply of cheap capital, to support both economic expansion and perennial current account deficits (namely in the US!). In addition, advanced economy central bankers tend to hew towards economic orthodoxy, which precludes them from intervening in forex markets, and obviates the need to accumulate forex reserves. Emerging economies, on the other hand, depend principally on exports to drive growth. As a result, many are driven towards holding down their currencies in order to maintain competitiveness. China has taken this to an extreme, by exercising rigid control over the value of the Yuan, and necessitating the accumulation of $3 trillion in foreign exchange reserves.
This trend accelerated in 2010 with the inception of the so-called currency wars (which have not yet abated). Competing primarily with each other, emerging economies bought vast sums of foreign currency in order to promote economic recovery. Many countries from South America and Asia which don’t normally intervene were also drawn in. The result was a tremendous accumulation of foreign exchange reserves, which is reflected in the chart above.
There is already evidence that this phenomenon is starting to reverse itself. Consider first that advanced economies have participated in the currency wars as well. Japan’s reserves have swelled to more than $1.1 Trillion. Switzerland spent $200 Billion defending the Franc, and South Korea has spent more than $300 Billion over the last five years trying to hold down the Won. The Bank of England (BOE) recently announced plans to rebuild its reserves (the majority of which were redeployed towards gilt purchases). The European Central Bank (ECB) has announced similar plans, and may be joined by the Bank of Canada and US Federal Reserve Bank.
Advanced economies need currency reserves for a couple reasons. First of all, they can no longer rely on monetary easing to reduce their exchange rates because of the inflationary side-effects. Second, the recent coordinated intervention on Japan’s behalf showed that the G7 will move to protect its members when need be. Finally, political forces are compelling advanced economies to slow the outflow of jobs and production, and this requires more competitive exchange rates.
Emerging economies, meanwhile, are starting to recognize that unchecked reserve accumulation is neither sustainable nor desirable. First of all, managing those reserves can be tricky. Intervention is not free, and exchange rate and investment losses must be accounted for somewhere. Second, continued intervention has several detrimental byproducts, namely inflation and the handicapping of domestic industry. Finally, emerging economy currency appreciation is inevitable. Constant intervention merely forestalls the inevitable and invites unending speculation and inflows of hot-money.
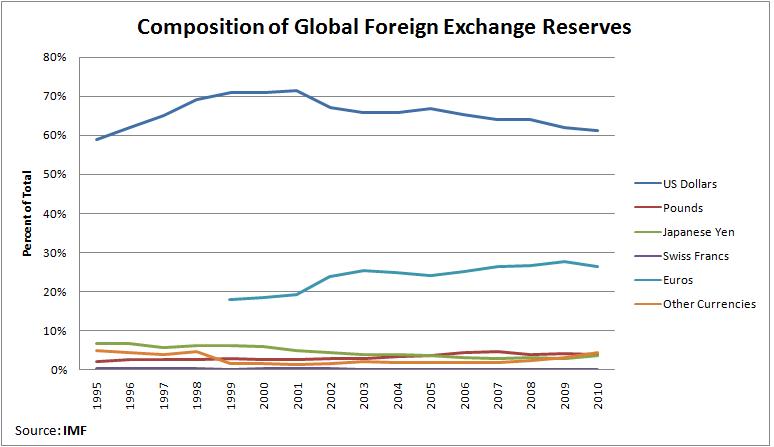
There are a few of ways that currency investors can position themselves for this change. As emerging market economies stop the accumulation of (or worse, sell off) their reserves, a major source of demand for advanced economy currency will be curtailed. This will accelerate the broad-based appreciation of emerging market currencies against their advanced economy counterparts. At the same time, I’m not sure how much reshuffling we will say in the composition of reserves. The euro is plagued by existential uncertainty, while the yen and pound have serious fiscal problems. In the short-term, the Chinese Yuan is prevented by several factors from becoming a legitimate reserve currency, namely that it is too difficult to obtain. (As soon as this changes, you can bet that emerging economy central banks will begin accumulating it. After all, they are competing with China – not with the US). The dollar is certainly also an “ugly” currency, but given the size of the US economy, the depth of its capital markets, and the liquidity with which the dollar can be traded, it will remain the go-to choice for the immediate future.
In the short-term, traders that wish to short advanced economy currencies (namely the Japanese yen) can do so in the secure knowledge that they are backstopped by the G7 central banks. It’s like you have an automatic put option that limits downside losses. If the Yen falls, you win! If the yen rises, the BOJ & G7 should step in, and at least you won’t lose!